

Collect VMware vCenter and ESXi performance metrics and send them to InfluxDB
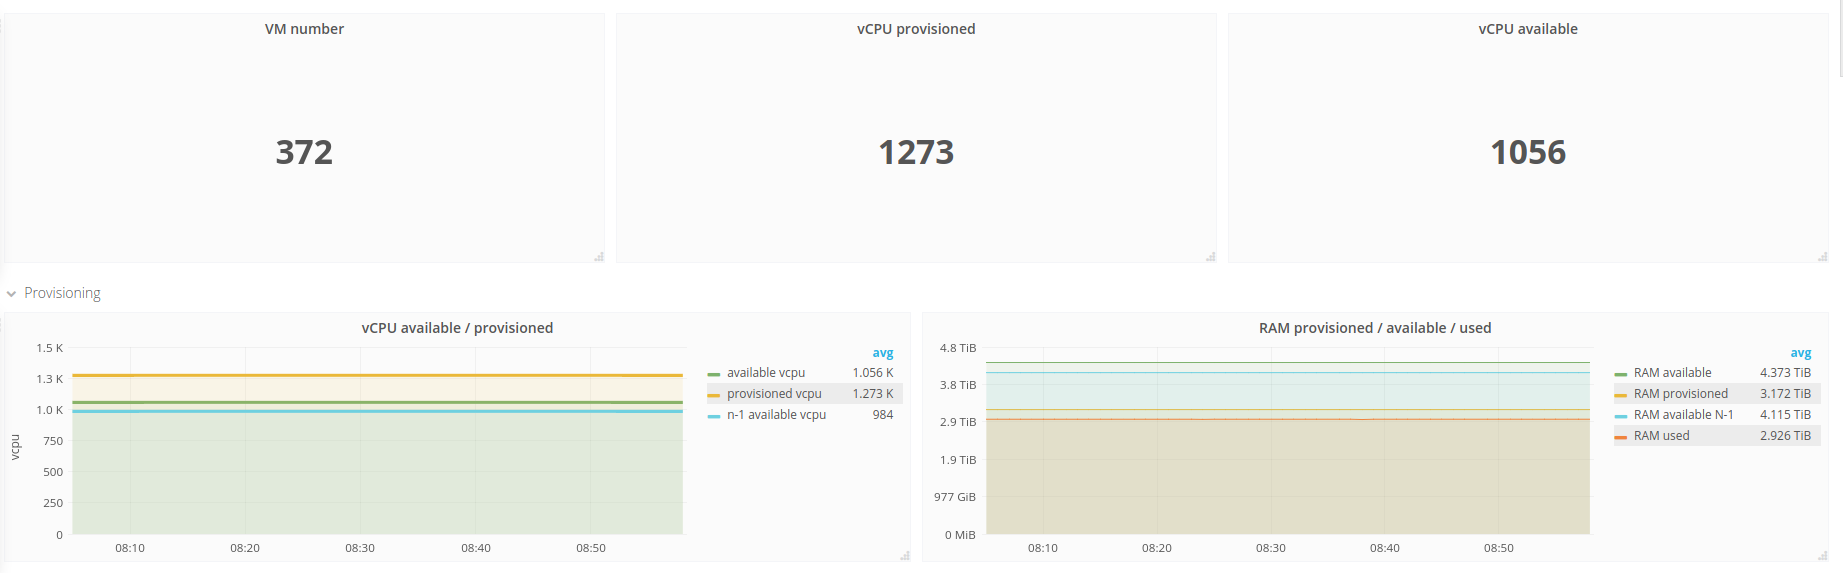
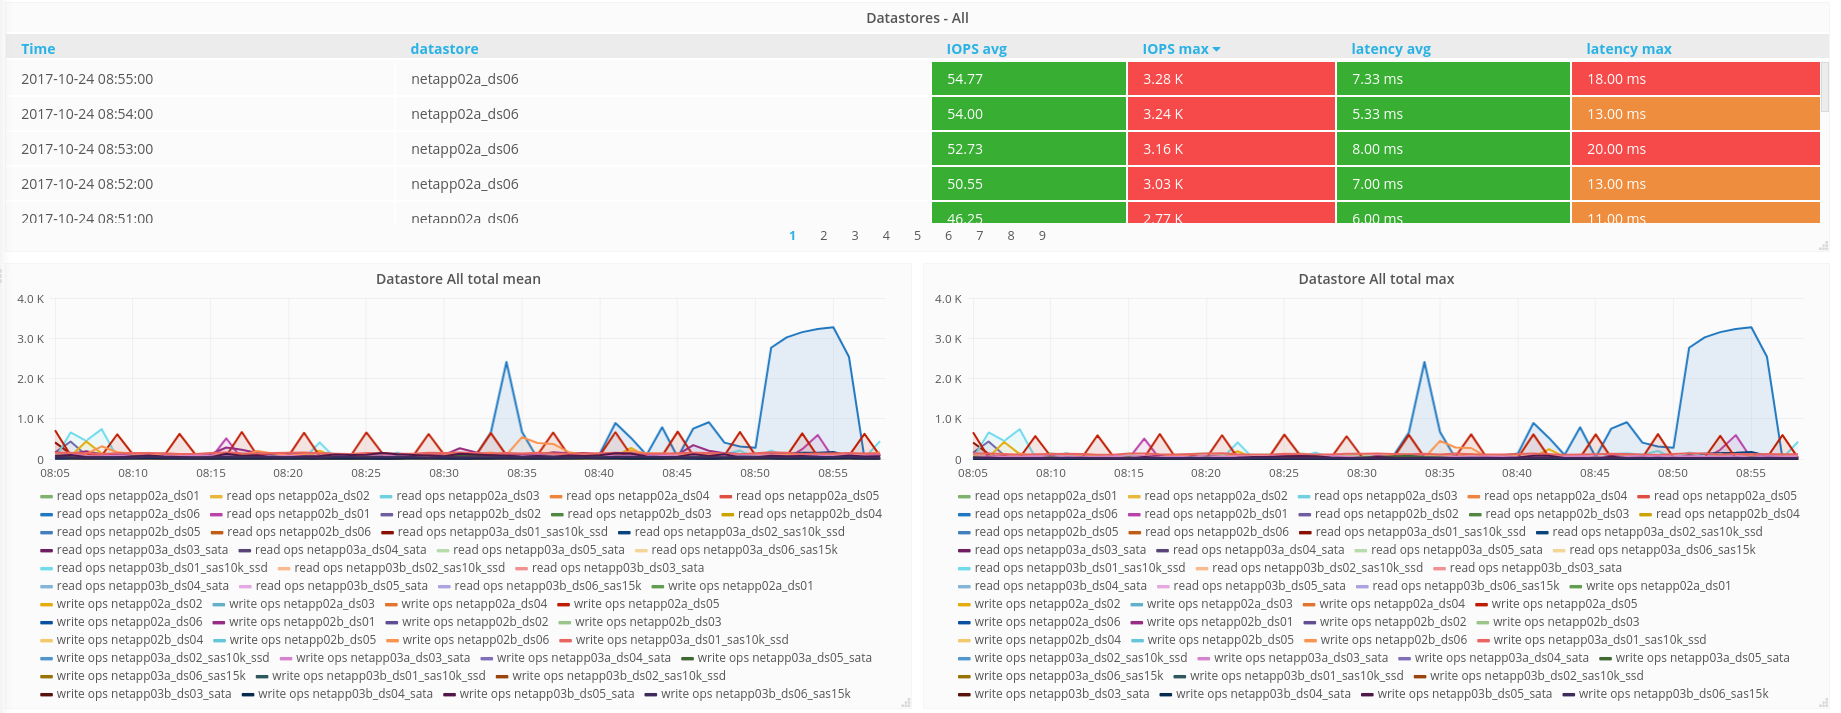
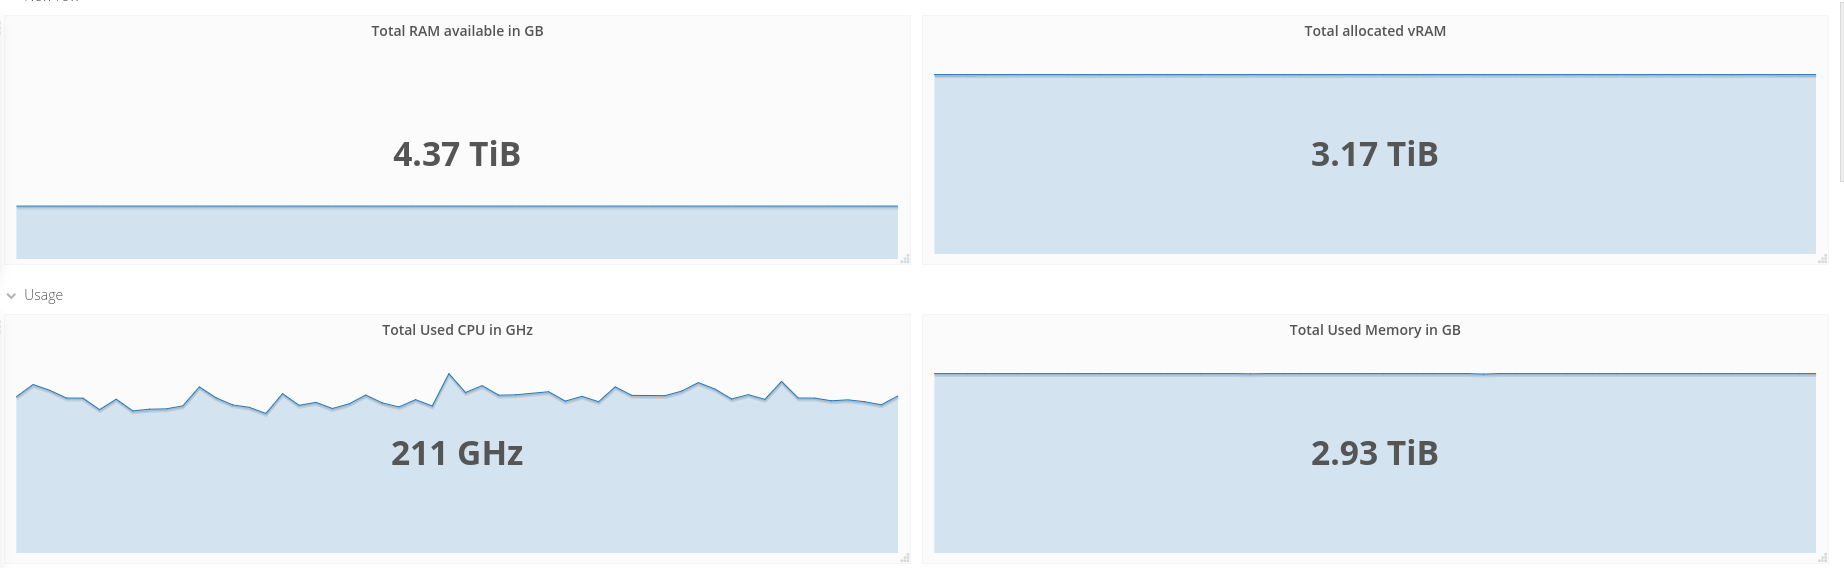
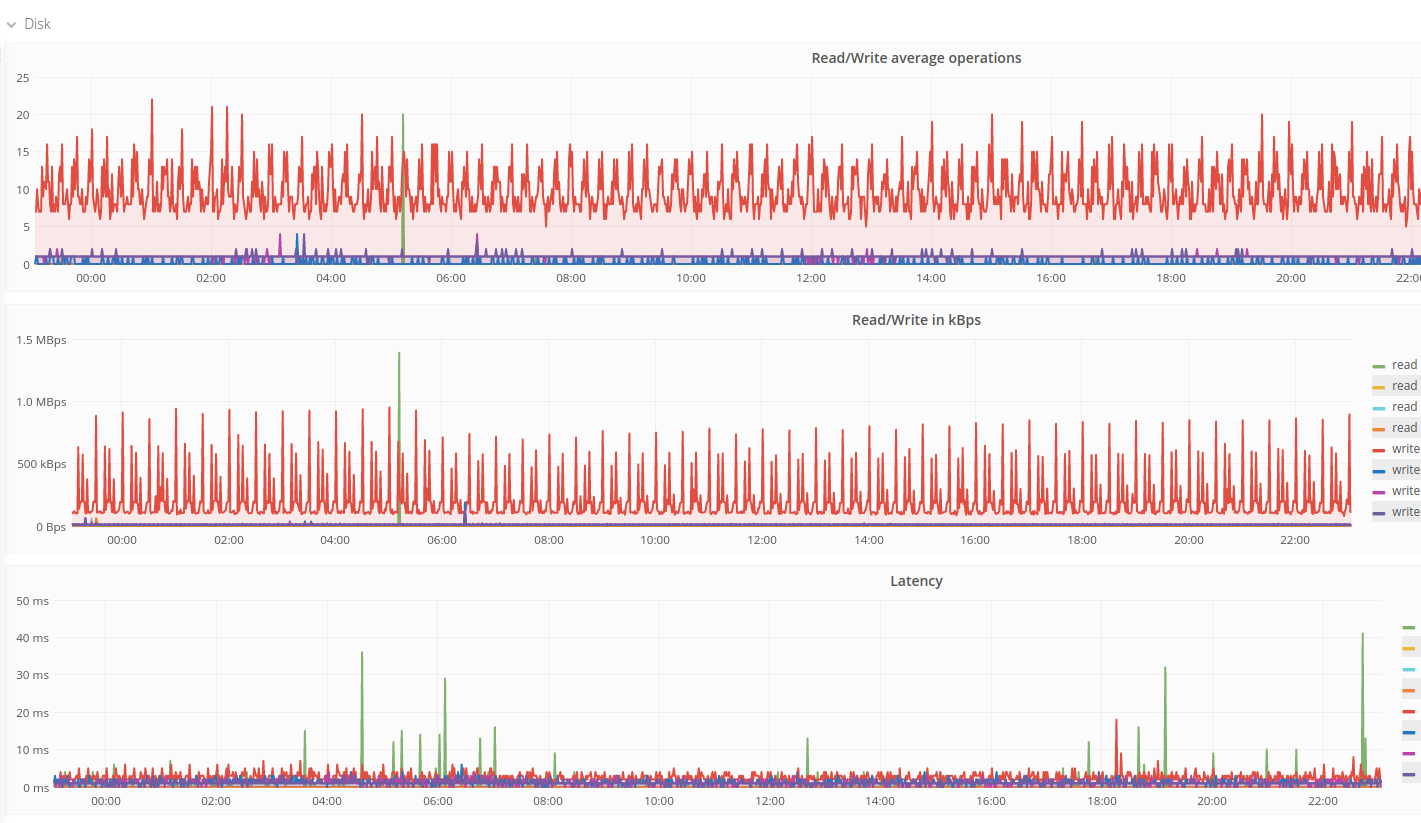
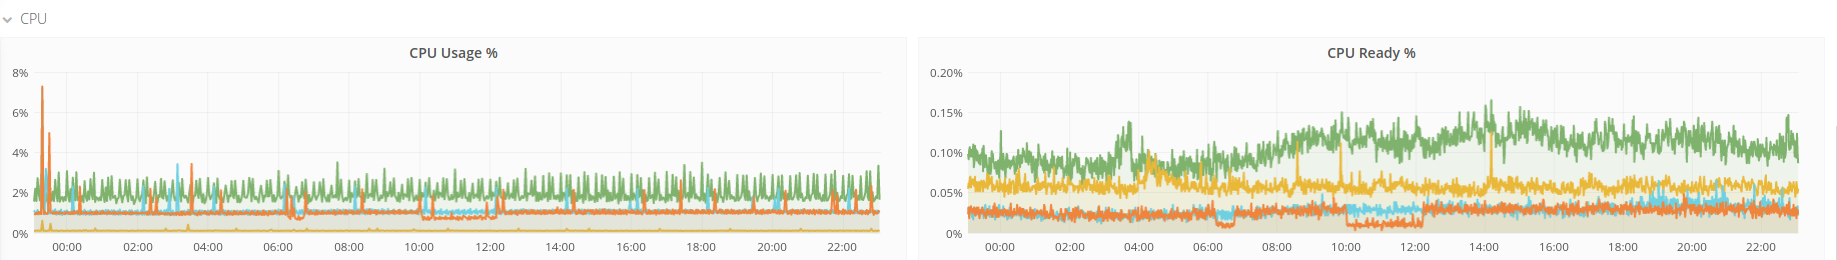
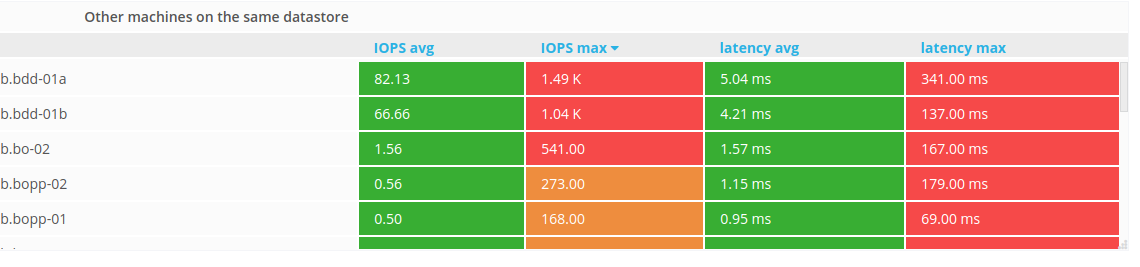
Screenshots of Grafana dashboards
Description and Features
This is a tool written in Go that helps you do your own custom tailored monitoring, capacity planning and performance debugging of VMware based infrastructures. It collects all possible metrics from vCenters and ESXi hypervisors about hosts, clusters, resource pools, datastores and virtual machines and sends them to an InfluxDB database (a popular open source time series database project written in Go), which you can then visualise in Grafana (links to sample dashboards below) or Chronograf, and use Grafana, Kapacitor or custom scripts to do alerting based on your needs, KPIs, capacity plannings/expectations.
Install
Grab the latest release for your OS (deb, rpm packages, exes, archives for Linux, Darwin, Windows, FreeBSD on amd64, arm6, arm7, arm64 are available) and install it.
For Debian/Ubuntu on adm64:
curl -L -O $(curl -s https://api.github.com/repos/Oxalide/vsphere-influxdb-go/releases | grep browser_download_url | grep '64[.]deb' | head -n 1 | cut -d '"' -f 4)
dpkg -i vsphere-influxdb-go*.deb
CentOS/Red Hat on amd64:
curl -L -O $(curl -s https://api.github.com/repos/Oxalide/vsphere-influxdb-go/releases | grep browser_download_url | grep '64[.]rpm' | head -n 1 | cut -d '"' -f 4)
rpm -i vsphere-influxdb-go*.rpm
This will install vsphere-influxdb-go in /usr/local/bin/vsphere-influxdb-go and an example configuration file in /etc/vsphere-influxdb-go.json that needs to be edited.
Configure
The JSON configuration file in /etc/vsphere-influxdb-go.json contains all your vCenters/ESXi to connect to, the InfluxDB connection details(url, username/password, database to use), and the metrics to collect(full list here ).
Note: Not all metrics are available directly, you might need to change your metric collection level. A table with the level needed for each metric is availble here, and you can find a python script to change the collect level in the tools folder of the project.
Additionally you can provide a vCenter/ESXi server and InfluxDB connection details via environment variables, wich is extremly helpful when running inside a container:
For InfluxDB:
- INFLUX_HOSTNAME
- INFLUX_USERNAME
- INFLUX_PASSWORD
- INFLUX_DATABASE
For vSphere:
- VSPHERE_HOSTNAME
- VSPHERE_USERNAME
- VSPHERE_PASSWORD
Keep in mind, that currently only one vCenter/ESXi can be added via environment variable.
If you set a domain, it will be automaticaly removed from the names of the found objects.
Metrics collected are defined by associating ObjectType groups with Metric groups.
There have been reports of the script not working correctly when the time is incorrect on the vsphere or vcenter. Make sure that the time is valid or activate the NTP service on the machine.
Run as a service
Create a crontab to run it every X minutes(one minute is fine - in our case, ~30 vCenters, ~100 ESXi and ~1400 VMs take approximately 25s to collect all metrics - rather impressive, i might add).
* * * * * /usr/local/bin/vsphere-influxdb-go
Example dashboards
- https://grafana.com/dashboards/1299 (thanks to @exbane )
- https://grafana.com/dashboards/3556 (VMware cloud overview, mostly provisioning/global cloud usage stats)
- https://grafana.com/dashboards/3571 (VMware performance, mostly VM oriented performance stats)
Contributions welcome!
Compile from source
go get github.com/oxalide/vsphere-influxdb-go
This will install the project in your $GOBIN($GOPATH/bin). If you have appended $GOBIN to your $PATH, you will be able to call it directly. Otherwise, you'll have to call it with its full path. Example:
vsphere-influxdb-go
or :
$GOBIN/vsphere-influxdb-go
TODO before v1.0
- Add service discovery(or probably something like Viper for easier and more flexible configuration with multiple backends)
- Daemonize
- Provide a ready to use Dockerfile
Contributing
You are welcome to contribute!
License
The original project, upon which this one is based, is written by cblomart, sends the data to Graphite, and is available here.
This one is licensed under GPLv3. You can find a copy of the license in LICENSE.txt